Rivian Blue
Member
- Joined
- Nov 14, 2024
- Messages
- 217
- Reaction score
- 17
- Rivian
- R1S Rivian Blue
Has anyone noticed the yellow bar will not max out at highways speeds at full throttle in sport Try it in all purpose and while the response is slow you will see the bar max out. (Assuming sufficient charge temps, and traction).
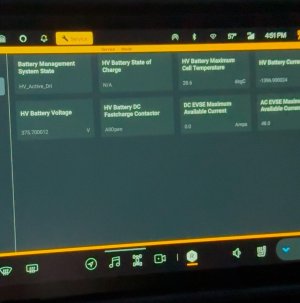
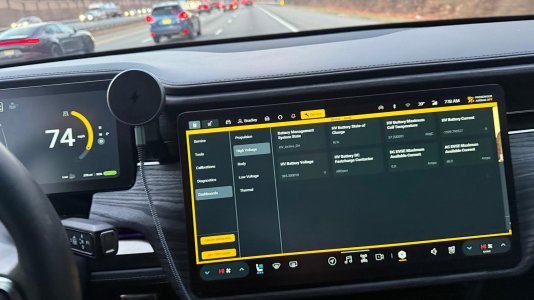
I love performance and data so this might not be enough for me. I used the service screen to confirm that in sport while at low speeds you will get 1600amp briefly above 40mph the amps max out at 1400amps, in all purpose over 40 you will get 1600amps. With a full charge the voltage will sag to about 385v if you do the maths 385x1600 =616kw or about 825hp this seems on point. But why why why do we only get 700hp when in sport over 40?
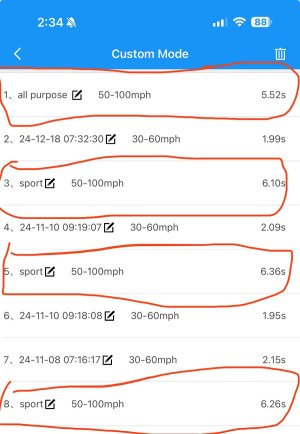
I was even more shocked when this was backed up by repeated 50-100 runs using a “draggy” measuring device.
Average 50-100
Sport 6.25
All purpose 5.52
That is 14% slower in sport!
I ran this experiment on multiple days slightly varying all possible variables like ride hight traction control ect and yet the results are consistent within a few %. I would love to see if anyone else can confirm this. The good news is that the yellow bar is a true representation of the amps. Or power however you want to think of it. Just imagine 835hp or 1600amps at the top (gen1 quad)
I would also love to see if this is the case on some of the other motor setups especially if someone is willing to get in the service screens and see what amps the Gen2's are pulling.
First photo is sport , second is all purpose 3rd is draggy comparison of 50-100 times


