Vincent
Active Wheeler
- Joined
- Oct 16, 2024
- Messages
- 244
- Reaction score
- 26
- Rivian
- R1T
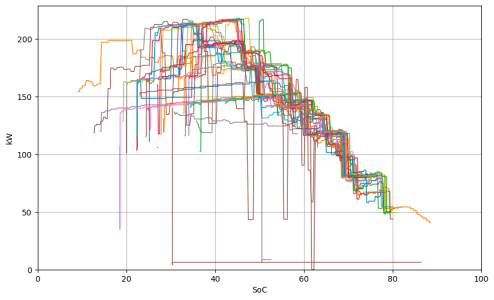
I've put a lot of miles on my R1T in the last month, and so I've accumulated a large number of charging sessions recently. I decided to quickly plot the data to see what an "average" curve looks like. It turns out there's not really a typical curve (which I suppose isn't really a surprise.).

Some notes:
• These are mostly Electrify America sessions, with a handful of EVgo and Rivian Adventure Network, and one Supercharger mixed in
• Every one of these sessions should have had battery precharging occur.
• Ambient ranged from about 30F to 70F
• There's one session in there that isn't actually a L3 session, but because of the way the telemetry is reported through HA, it made it past my filter. I didn't feel like adjusting my script to filter this out.
• On this whole trip, the only charging problem I had was with a RAN station. Go figure. I was entirely unable to charge, and had to go elsewhere, after phone support was clueless
• The brown session that dipped below 50kW a couple times between 40 and 60% was on EA.
For plotting, the curves are all truncated on the starting (low-SoC) side until charge rate hit at least 100kW. I did this to make the chart a little less busy.


